Gain new insides with the upgraded reporting at country-level, decide on user-level reporting access, and discover some small changes that make your life as content creator way easier.
Extended and more granular reporting
- Impact
- Back Office
")
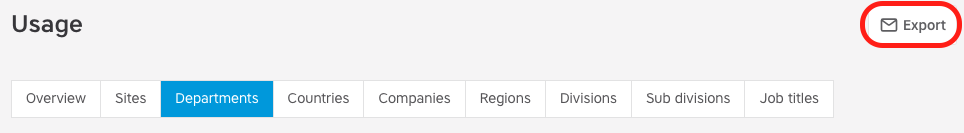
The Usage page now gives you reports on a granular level. You can browse through different views where you see the usage and activation shown for different sites, departments, countries, regions, divisions, subdivisions and job titles.
For example, this more granular reporting allows you to:
- Identify your “champion audiences”
- Compare different audience groups
- Find the audience groups that are lagging behind, either in adoption or in usage.
On the left, you see graphs that show activation: how many users have downloaded the app and successfully logged in to it, compared to the total number of users in that group? This number is especially important in the first phase of roll out of the platform.
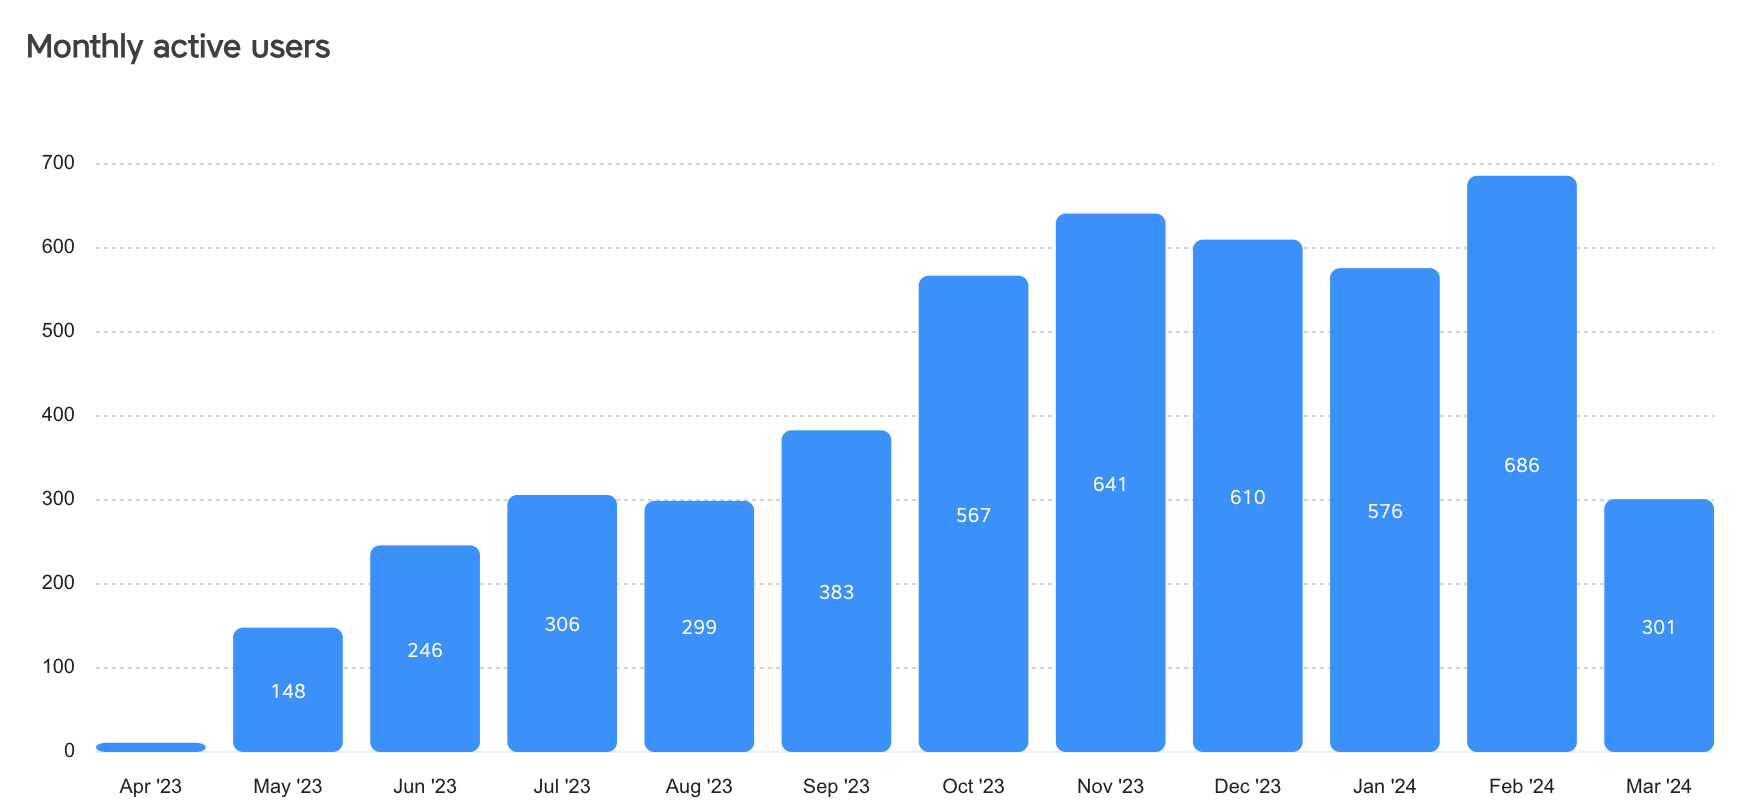
On the right, you see how often people use the platform: when have they last logged in to it?
To make the platform a long term success, you want users to be active at least monthly, but this also depends on how much content you publish and whether the app has features that make daily life easier for users. In the latter case, this might boost daily usage a lot.
")
On the different levels, you can use several filters to see your target audiences in different ways:
1. Search for a specific audience group.
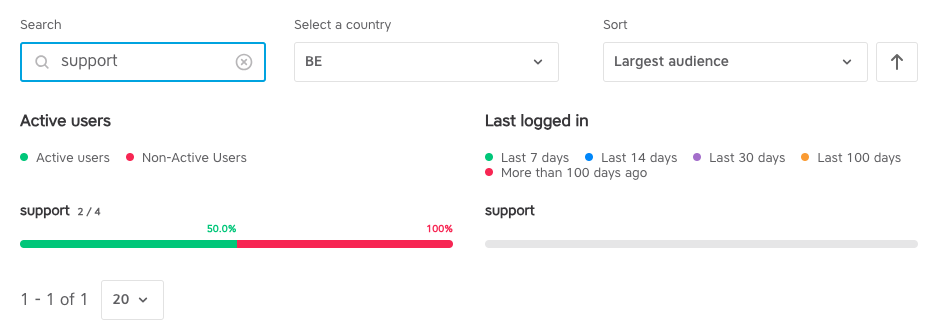
2. Filter on country level.
3. And sort based on activation, usage, name or how big an audience is.
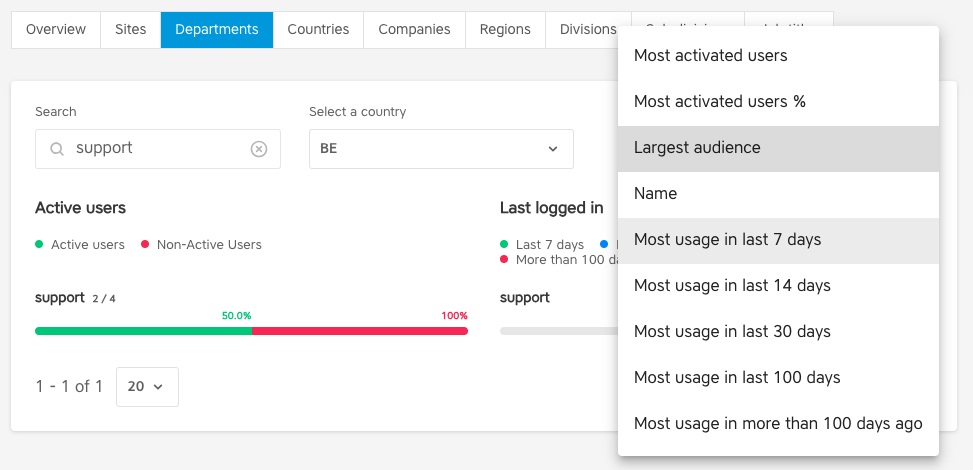
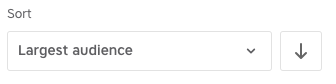
Want to see this sort from smallest to largest or from Z to A? Click the arrow and the order is reversed.
With the export button in the top right corner, you can export the filtered view that you have created that way. It is delivered in a csv file in your mailbox.
On the overview page, you now also find a graph that shows when your content is mostly read. It can help you to figure out the ideal moment to post your articles.
The News page now gives you insights about which topics are used most and who are your most active content creators. The general graph that shows how many posts are published now has filters on content creator, topic and year.
This can help you identify:
- your most active content creators, your “champions”
- the content creators who need some extra encouragement to publish
")
Two new reports
We added two new pages to the Reporting tab: Videos and Most viewed.
The Videos page gives you reporting about the featured videos. These are the videos that are uploaded directly to the platform (and not embedded from YouTube or another video platform). You can filter the view on different years of publication.

The Most viewed page gives you insights about what content is working, or: most viewed.
Similar to usage, we offer different filters: country, site, department, user role and year of publication.

These allow you to see what content is working with which target audience. Very valuable insights for building your content strategy!
Again, click the Export button to receive the view you filtered on in a csv file in your inbox.
Multi-country back office
- Impact
- Back Office
For customers with multiple countries, sites, plants, … managed by multiple admins and content creators, we made it easy for them to manage topics, links, user lists, and document libraries.
How do you make this work?
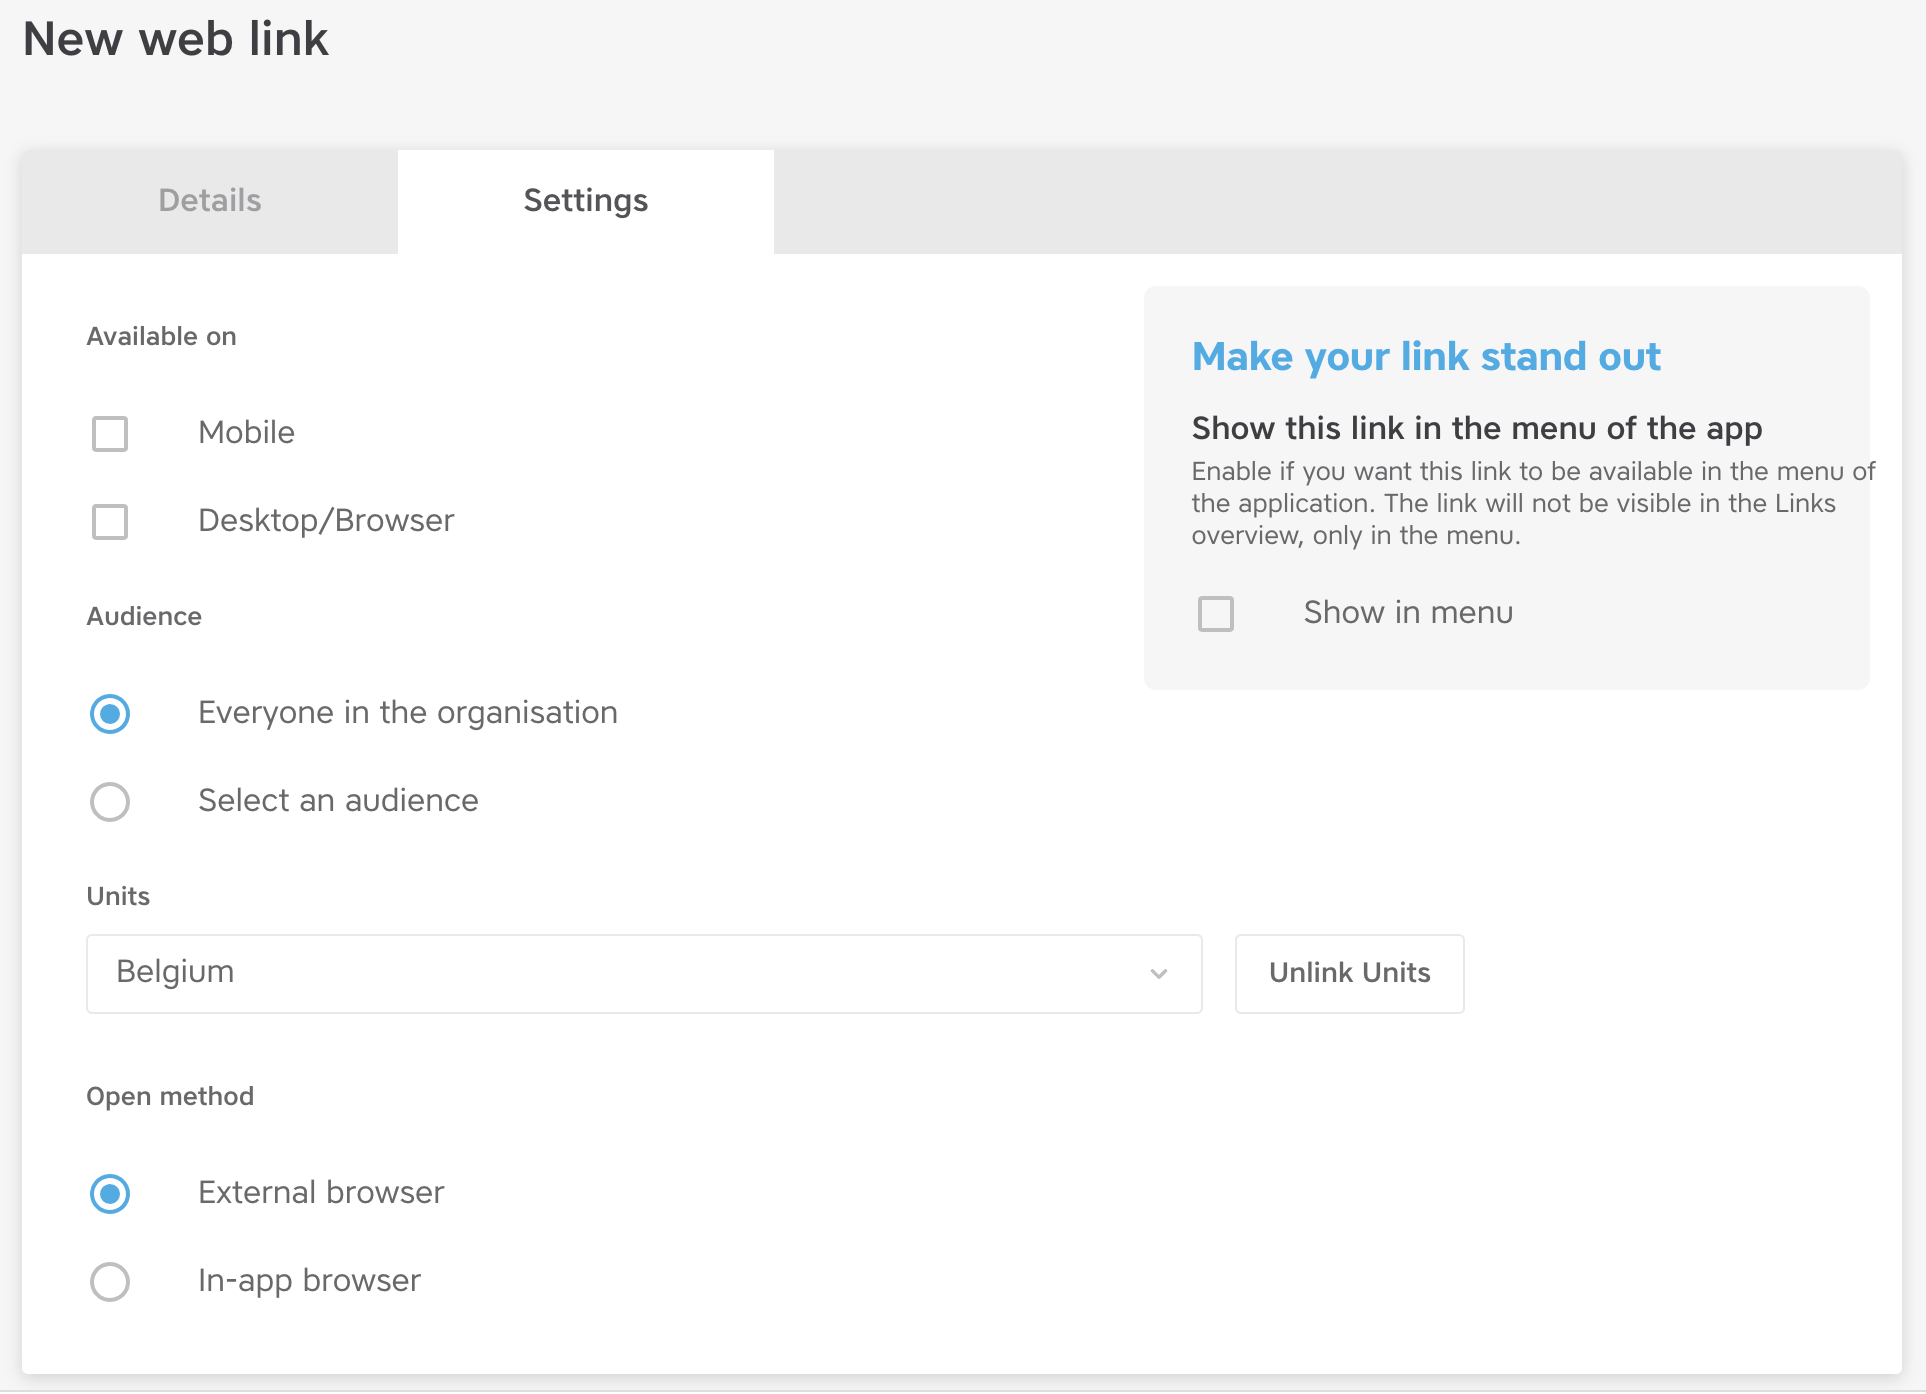
As a superadmin, you can link a content creator or local admin to a unit (= country, business unit, division, plant …) in the back office.

When you create a link, a topic or a user list, you can link this to a unit. If you don’t link it to a unit, it stays visible for everyone.
We can also filter the document library so content creators and admins can only see their own document library.
Superadmins keep the overview over all content in the back office.
Access reporting
- Impact
- Back Office
Would you like to give certain back office users access to the reporting? Good news, we added a role ‘Reporting admin‘.
How to give a back office user access?
Go to user management, search for the profile of the user and ‘Reporting admin’ as role.

User sync errors
- Impact
- Back Office
From now on, you can validate in the back office if the latest user syncs were successful or not.
note: You will still be notified by email when the last sync fails.
Where to find the reports?
Go to ‘User Management’ and click right above the button Actions > User sync reports.
Here you get an overview of the latest user syncs, status, and the error message if applicable.
In the next update, you will be able to download the csv file straight from the back office to solve the issue. Afterwards, you can upload the updated csv file in the back office or on your SFTP server.

Small updates/bug fixes
- Impact
- Back Office
- Topics and user lists are from now on alphabetical in the dropdowns in the content creator BO.
- The overview of topics now shows all topics on 1 page for easier sorting.
- User lists: added the publication count in the export.
- The survey export includes more user data. The columns email and external ID are added.
- The expiration date on running surveys can be set again.
- Do you want to create a user manually with SSO login? The authentication ID can now be manually adjusted/created in the BO for the manual creation of users who need SSO.
Any questions?
Our support team is here to make your life easier!